So, my Machine Learning project is due in 5 days. We’ve had it since just over a week ago, but also had a homework due in the meantime, so I’m just getting to it. I only have a short time to understand how to do this project, plus I have homework in another class due Monday, so I’m working under pressure. [For those of you that don’t know, I’m in a “synchronous” online Systems Engineering Masters degree program (sitting in on live classes via video feed), and have a Risk Analysis class 2 afternoons per week, and a Machine Learning class one night each week. I also work full-time as a data analyst.]
The part of the project I’m working on first is the Naive Bayes Classifier. The professor gave us very little info about how to approach this project, but luckily there are several approaches and explanations available online I can use as guides. We have to develop our own functions, but I’m going to do it with built-in functions first so I can better understand what the result is supposed to look like.
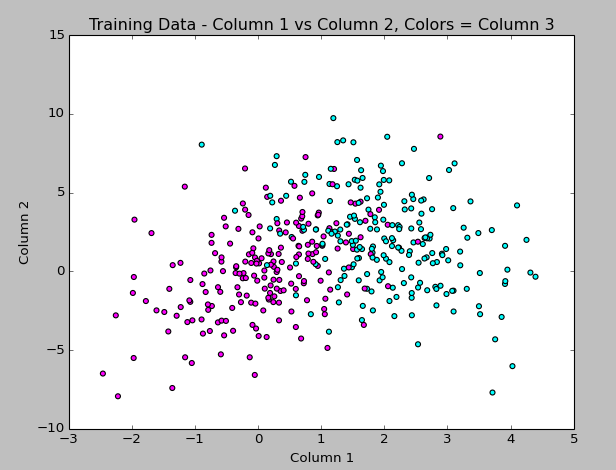
The first thing I did is make sure I understand the training data, which has 2 floats and an integer (really, a boolean 1/0) value. I realized that plotting all 3 columns of the data in the graph last week wasn’t really solving anything because having the “label” (result boolean) in the graph just split apart the classes more. So, I figured out how to graph the points using the first two columns as x & y, then colorized the points by the 3rd column label value. This looks more like what I expect to see, so I’m happy with it!
The code to generate this is:
#matplotlib, pyplot, numpy
import matplotlib.pyplot as plt
import numpy as np

#get data from training file
data = np.genfromtxt('train.txt', delimiter = ' ',
          dtype="float, float, int", names = "col1, col2, col3")

#set up color map
import matplotlib.colors as col
import matplotlib.cm as cm
my_colors = ["magenta","cyan"]
my_cmap = col.ListedColormap(my_colors[0:len(my_colors)], 'indexed')
cm.register_cmap(name="mycmap", cmap=my_cmap)

#plot column 1 vs 2 and use column 3 value to apply color
plt.scatter(data["col1"],data["col2"], c=data["col3"], cmap=cm.get_cmap("mycmap"))
plt.title("Training Data - Column 1 vs Column 2, Colors = Column 3")

#label axes and display
plt.xlabel("Column 1")
plt.ylabel("Column 2")
plt.show()
(Hey look at that… syntax highlighting via the Crayon plugin!)
I continued, and picked SciKit-Learn to do the automated Naive Bayes (I have to rewrite a function to do this myself for the project, but wanted to see how it should look). The classifying seemed to work without too much trouble, but colorizing the scatterplot points using matplotlib did not work the way I expected, so that part took the longest to figure out!
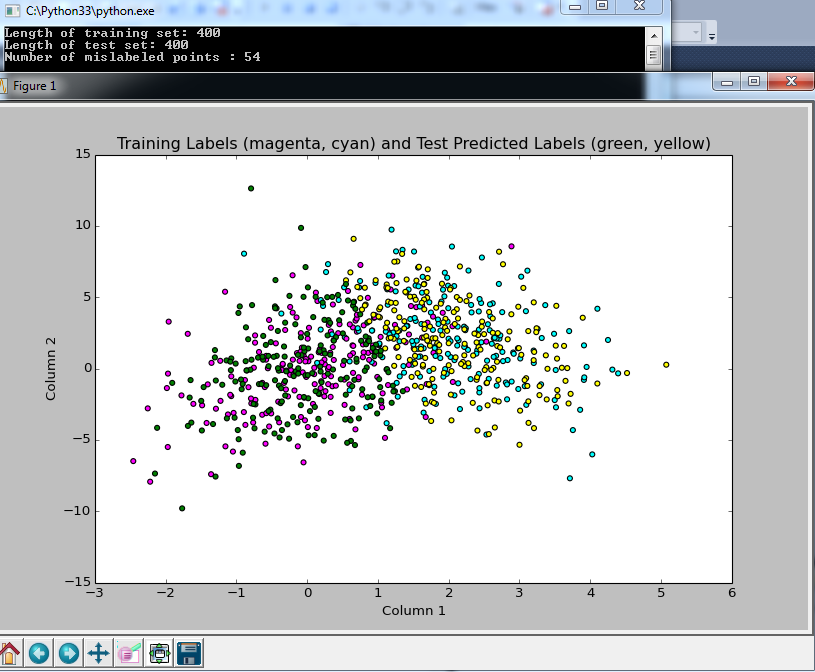
Here I plotted the results of the predicted boolean labels on the test data set based on the Naive Bayes model trained on the Train data set (both data sets provided by my professor). I know it’s not totally clear what I’m doing here, but the image shows the training data in magenta and cyan, with the test data overlayed, colored yellow or green based on the predicted class. I figure it’s a good sign that they overlap like this!
and here is the code:
#example from: http://scikit-learn.org/stable/modules/naive_bayes.html
#from sklearn import datasets
#iris = datasets.load_iris()
#from sklearn.naive_bayes import GaussianNB
#gnb = GaussianNB()
#y_pred = gnb.fit(iris.data, iris.target).predict(iris.data)
#print("Number of mislabeled points : %d" % (iris.target != y_pred).sum())

import numpy as np

#bring in data from files
ftrain = open("train.txt")
ftest = open("test.txt")
data_train = np.loadtxt(ftrain)
data_test = np.loadtxt(ftest)
#can't define 3rd column as integer, or it will collapse to 1D array and next line won't work?
Xtrn = data_train[:, 0:2]  # first 2 columns of training set
Ytrn = data_train[:, 2]  # last column, 1/0 labels
Xtst = data_test[:, 0:2]  # first 2 columns of test set
Ytst = data_test[:, 2]  # last column, 1/0 labels
print("Length of training set: %d " % len(Xtrn))
print("Length of test set: %d " % len(Xtst))

#NAIVE BAYES WITH SCIKIT LEARN
from sklearn.naive_bayes import GaussianNB
gnb = GaussianNB()
#array of predicted labels for test set based on training set?
y_prediction = gnb.fit(Xtrn, Ytrn).predict(Xtst)
#print(y_prediction)
GaussianNB()
print("Number of mislabeled points : %d" % (Ytst != y_prediction).sum())

import matplotlib.pyplot as plt

#set up colors
import matplotlib.colors as col
import matplotlib.cm as cm
my_colors = ["magenta","cyan","green","yellow"]
my_cmap = col.ListedColormap(my_colors[0:len(my_colors)], 'indexed')
#had to add these bounds and mynorm in order to use color indexes below the way I expected it to work
bounds=[0,1,2,3,4]
my_norm = col.BoundaryNorm(bounds, my_cmap.N)
#register the color map with name mycmap
cm.register_cmap(name="mycmap", cmap=my_cmap)

#converting 3rd column to int to use as color index in scatterplot
import array
data_color = array.array('i')
for yitem in data_train[:, 2]:
    data_color.append(int(yitem))
#bring in test data in to view it, adding 2 to the labels get the 3rd and 4th colors from the map
data2_color = array.array('i')
for yitem in y_prediction:
    data2_color.append(int(yitem + 2))

#plot column 1 vs 2 and use 3 to apply color
plt.scatter(data_train[:, 0],data_train[:, 1], c=data_color, cmap=cm.get_cmap("mycmap"), norm=my_norm)
plt.title("Training Labels (magenta, cyan) and Test Predicted Labels (green, yellow)")
#plot column 1 and 2 in test data with different colors based on prediction
plt.scatter(data_test[:, 0],data_test[:, 1], c=data2_color, cmap=cm.get_cmap("mycmap"), norm=my_norm)
#plt.colorbar()
plt.xlabel("Column 1")
plt.ylabel("Column 2")
plt.show()
The output from the classifier says that only 54 data points (out of 400) were not classified properly, based on comparing the predicted label to the true label provided in the test file. Sounds good to me!
So at this point, I’ve only just started the project, but I’m getting more used to Python, and feel like I’m making some progress. I have homework for another class that I’ll probably spend most of tomorrow doing, but I’ll be back this week updating as I continue this project.
Again, I’m not soliciting any help at the moment since I want to do this project on my own if at all possible, but after I turn it in on Thursday, I’d love any advice you have about improving the approach!
I bookmarked all of these websites while figuring out how to write this code today. You can only guess how many I visited!