This weekend, I played around with the newly-released Google Cloud Datalab. I learned how to use BigQuery and also played around with Google Charts vs Pandas+Matplotlib plots, since you can do both in Datalab.
I had a few frustrations with it because the documentation isn’t great, and also sometimes it would silently timeout and it wasn’t clear why nothing was running, but if I stopped all of the services, closed, restarted DataLab, and reopened, everything would work fine again. It’s clearly in Beta, but I had fun learning how to get it up and running, and it was cool to be able to write SQL in a Jupyter notebook.
I tried to connect to my Google Analytics account, but apparently you need a paid Pro account to do that, so I just connected to one of the built-in public datasets. If you view the notebooks, you will see I clearly wasn’t trying to do any in-depth analysis. I was just playing around and getting the queries, dataframes, and charts to work.
I hadn’t planned to get into too many details here, but wanted to share the results. I did jot down notes for myself as I set it up, which I’ll link to below, and you can see the two notebooks I made as I explored DataLab.
Exploring BigQuery and Google Charts
Version Using Pandas and Matplotlib
(These aren’t tidied up to look professional – please forgive any typos or messy approaches!)
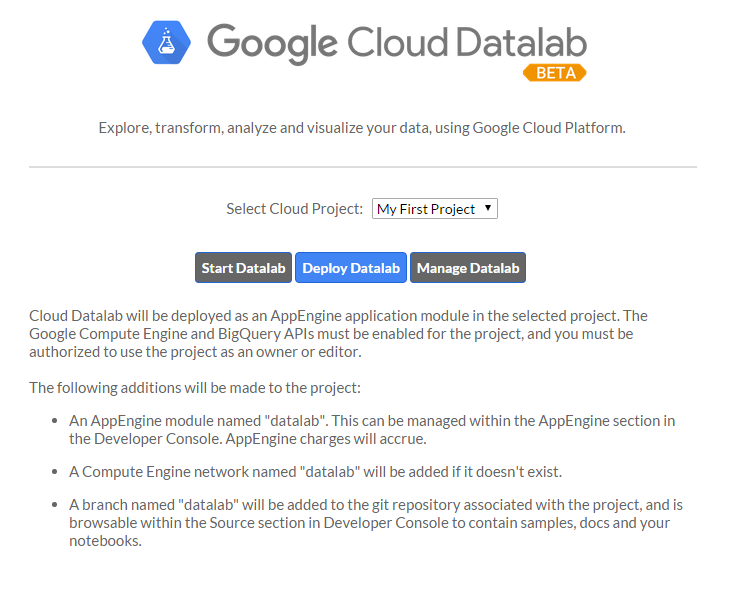
Google Cloud Datalab Setup Notes (These are notes I jotted down for myself as I went through the setup steps. Sorry if they’re not intelligible!)
hi,
what are the names of all the packages needed to successfully run the examples in the “Exploring BigQuery and Google Charts” article?
thanks.