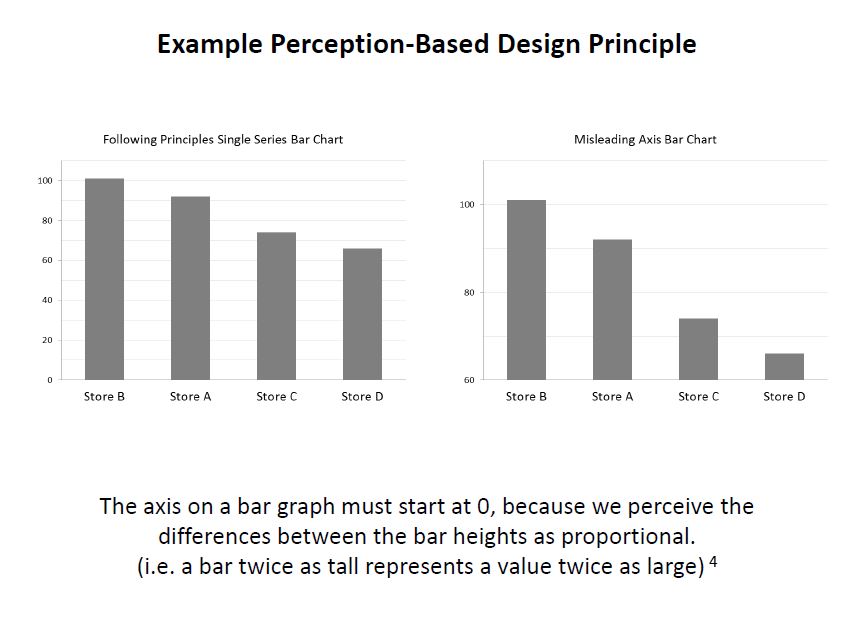
You may have seen me tweeting about some research I did on “Data Visualization for Exploratory Data Analysis” for my Cognitive Systems Engineering course. My presentation went really well! I’m less satisfied with the paper since it was done in a hurry to complete the project deliverables, but i’m including it because it explains some things that aren’t obvious from the powerpoint without my commentary.
Principles of Data Visualization for Exploratory Data Analysis [presentation – pdf]
Principles of Data Visualization for Exploratory Data Analysis [paper – [pdf]
Check out the references in both documents for some good resources. I’ll include some links in the post below, too. I had a lot more material from my research that I wanted to include and just didn’t have time to in a 15-minute presentation! The professor was happy about the topic I picked because she’s teaching a class on Data Visualization next semester, so I think that worked out in my favor :)
These two books by Stephen Few covered the very basics of visualization for human perception:
Show Me the Numbers: Designing Tables and Graphs to Enlighten
Now You See It: Simple Visualization Techniques for Quantitative Analysis
Blog posts about related topics:
Six Revisions: Gestalt Laws
eagereyes: Illustration vs Visualization
Detailed visualization of NBA shot selection
Publications and articles:
IEEE Transactions on Visualization and Computer Graphics
Toward a Perceptual Science of Multidimensional Data Visualization: Bertin and Beyond by Marc Green, Ph. D.
Scagnostics by Dang and Wilkinson
Generalized Plot Matrix (GPLOM) by Im, McGuffin, Leung
UpSet: Visualization of Intersecting Sets by Lex, Gehlenborg, Strobelt, et al.
…and there are more resources in the paper and presentation files! (and if you’re REALLY interested in this topic, post a comment and I will add even more links I have bookmarked)
I also did a project using some data from my day job related to university fundraising and major gift prospects, but unfortunately I can’t share that study here because I don’t have permission to do so. It included some cool visuals like bubble charts, and also an interesting analysis of movement through the prospect pipeline using Markov Chains. I learned a lot doing that one!
It was nice to end my final semester of grad school with two data-related projects! (Yes, I’m finally graduating! Masters of Systems Engineering! woo hoo!)
