This post details a casual exploratory project I did over a few days to teach myself more about classifiers. I downloaded the Heart Disease dataset from the UCI Machine Learning respository and thought of a few different ways to approach classifying the provided data.
——————————————-
“MANUAL” APPROACH USING EXCEL
So first I started out by seeing if I could create a scoring model in Excel which could be used to classify the patients. I started with the Cleveland data set that was already processed, i.e. narrowed down to the most commonly used fields. I did some simple exploratory data analysis on each field using pivot tables and percentage calulations, and decided on a value (or values) for each column that appeared to correlate with the final finding of heart disease or no heart disease, then used those results to add up points for each patient.
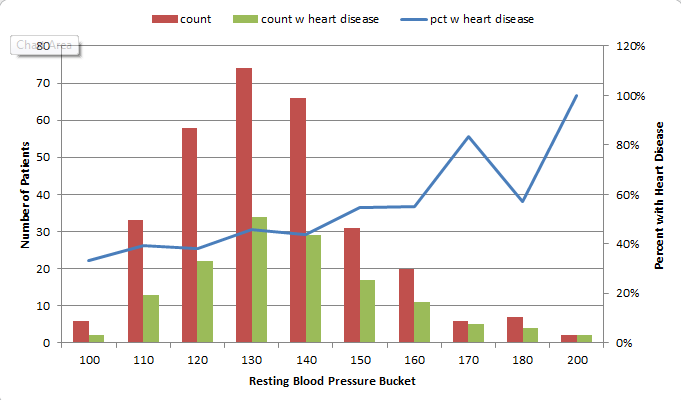
For instance, I found that 73% of patients with Chest Pain Type 4 ended up being diagnosed with heart disease, where no higher than 30% of patients with any other Chest Pain Type ended up with that result. So, the people that had a 4 in the “chest pain type” column got 2 points. For Resting Blood Pressure, I grouped the values into 10-point buckets, and found that patients with a resting blood pressure value of below 150 had a 33-46% chance of being diagnosed with heart disease, where those with 150 and up had a 55-100% chance. So, patients with 150 or above in that column got an additional point.
Points ended up being scored for the following 12 categories:
- Age group >=60
- Sex = male
- Chest Pain Type 4 [2 points]
- Resting Blood Pressure group >= 150
- Cholestoerol >= 275
- Resting ECG > 0
- Max Heart Rate <= 120 [2 points], between 130 and 150 [1 point]
- Exercise-induced Angina = yes [2 points]
- ST depression group >=1 [1 point], >=2 [2 points]
- Slope of ST segment > 1
- Major Vessels colored by Fluoroscopy = 1 [1 point], >1 [2 points]
- thal = 6 [1 point], thal = 7 [2 points]
This was a very “casual” approach which I would refine dramatically for actual medial diagnosis, but this was just an exercise to see if I could create my own “hand-made” classifier that could actually predict anything. So at this point I had to decide how many points merited a “positive” (though not positive in the patients’ eyes) diagnosis of heart disease. I tried score thresholds of between 6 and 9 points, and also tried a percentage-based scoring system, and the result with the most correct classifications was at 8 points. (8+ points classified the patient as likely having heart disease.) However, the 8-point threshold had a higher false negative rate than the lower thresholds, so if you wanted to make sure you were not telling someone they didn’t have heart disease when they in fact did, you would use a lower threshold.
The final results with the 8-point threshold were:
| true positive | 112 | 37% |
| false positive | 18 | 6% |
| true negative | 146 | 48% |
| false negative | 27 | 9% |
| correct class | 258 | 85% |
I remembered that the symptoms for heart disease in males and females could look very different, so I also looked at the “correct class” percentages for each sex. It turns out that my classifier classified 82% of males correctly, and 93% of females. Because of how long it took to create this classifier “the manual way”, I decided not to redo this step to create a separate classification scheme for each sex, but I decided to test out training separate models for men and women when I try this again using Python.
TESTING THE MODEL
I made the mistake of not checking out the other data sets before dividing the data into training and test sets. Luckily the Cleveland dataset I used for training was fairly complete. However, the VA dataset had a lot of missing data. I used my scoring model on the VA data, but ended up having to change the score threshold for classifying, because the Cleveland (training) dataset had rows with an average of almost 11 data points out of 12, but the VA (test) dataset only averaged about 8. So, I lowered the threshold to 6 points and got these results:
| true positive | 140 | 70% |
| false positive | 38 | 19% |
| true negative | 13 | 7% |
| false negative | 9 | 5% |
| correct class | 153 | 77% |
This time, separating out the sexes, it classified only 67% of the females correctly, but 77% of the males. However, there were only 6 females (out of 200 records) in the dataset, so that result doesn’t mean much.
I think classifying 77% of the records correctly is good for a model created as haphazardly as this one was! I learned good lessons about checking out all of the available data before starting to develop a plan for training and testing, and also again encountered an imbalanced dataset like I did in one of my graduate Machine Learning class projects.
——————————————-
AUTOMATED DATA MINING USING PYTHON
Now that I “played around” with creating my own model in Excel, I wanted to use code to create a classifier in Python. I had already written a classifier in Python for one of my other projects in Machine Learning grad class, but wanted to do it more quickly (and probably more correctly) using commonly-used Python packages designed for this type of work.
I decided to learn how to use the Pandas library since I had heard it makes the import and manipulation of data sets much simpler, and try both the Nearest Neighbors and Decision Trees classifiers from scikit-learn.
I had a little trouble getting everything set up the way it needed to be. I eventually got the right versions of the scipy-stack and scikit-learn in Python 3.3. Because I already had it installed and am familiar with it, I’m using Visual Studio as an IDE, but I’m probably going to drop that soon for something leaner. Commenters on Twitter suggested checking out Anaconda/miniconda for easy installs, so I plan to take a look at that soon.
I read the documentation on pandas and scikit-learn and figured out how to import data, manipulate it (For instance, some of the values were question marks. When I made the classifier in Excel (above), I deleted these. This time, I turned them into numeric values because the classifiers couldn’t handle Null values. I need to learn how to best handle these in a future practice session.)
Here is an example of importing the data from the CSV into a pandas dataframe:
#import the Cleveland heart patient data file using pandas, creating a header row
#since file doesn't have column names
import pandas as pnd
header_row = ['age','sex','pain','BP','chol','fbs','ecg','maxhr','eiang','eist','slope','vessels','thal','diagnosis']
heart = pnd.read_csv('processed.cleveland.data', names=header_row)
Here is where I converted the “diagnosis” values in the file to a 1/0 result (any value above 0 was a heart disease diagnosis):
#import and modify VA dataset for testing
heart_va = pnd.read_csv('processed.va.data', names=header_row)
has_hd_check = heart_va['diagnosis'] > 0
heart_va['diag_int'] = has_hd_check.astype(int)
And here is an example of training the Decision Tree classifier, then outputting the results of various tests:
#classification with scikit-learn decision tree
from sklearn import tree
clf2 = tree.DecisionTreeClassifier()
#train the classifier on partial dataset
heart_train, heart_test, goal_train, goal_test = cross_validation.train_test_split(heart.loc[:,'age':'thal'], heart.loc[:,'diag_int'], test_size=0.33, random_state=0)
clf2.fit(heart_train, goal_train )
heart_test_results = clf2.predict(heart_test)

#put the results into a dataframe and determine how many were classified correctly
heart_test_results = pnd.DataFrame(heart_test_results, columns=['predict'])
goal_test_df = pnd.DataFrame(goal_test, columns=['actual'])
heart_test_results['correct'] = heart_test_results['predict'] == goal_test_df['actual']

#print results of decision tree classification test
print("")
print("Decision Tree Result 1:")
print(heart_test_results['correct'].value_counts())
print(clf2.score(heart_test, goal_test))

#try the scikit-learn cross validation function
print("Decision Tree Cross-Validation:")
scores = cross_validation.cross_val_score(clf2, heart.loc[:,'age':'thal'], heart.loc[:,'diag_int'], cv=5)
print(scores)

#test classifier with other data (note: many values missing in these files)
print("Trained Decision Tree Applied to VA Data:")
heart_va_results = clf2.predict(heart_va.loc[:,'age':'thal'])
print(clf2.score(heart_va.loc[:,'age':'thal'], heart_va.loc[:,'diag_int']))
print("Trained Decision Tree Applied to Hungarian Data:")
heart_hu_results = clf2.predict(heart_hu.loc[:,'age':'thal'])
print(clf2.score(heart_hu.loc[:,'age':'thal'], heart_hu.loc[:,'diag_int']))
Interestingly, the results these classifiers got weren’t much better than my “homemade” classifier above! Here is the output from my code:
Nearest Neighbors (5) Result 1:
True 64
False 36
dtype: int64
0.64
Nearest Neighbors (5) Cross-Validation:
[ 0.62295082 0.67213115 0.63934426 0.65 0.7 ]
Trained Nearest Neighbors (5) Applied to VA Data:
0.615
Trained Nearest Neighbors (5) Applied to Hungarian Data:
0.421768707483
Decision Tree Result 1:
True 75
False 25
dtype: int64
0.75
Decision Tree Cross-Validation:
[ 0.7704918 0.75409836 0.73770492 0.8 0.76666667]
Trained Decision Tree Applied to VA Data:
0.65
Trained Decision Tree Applied to Hungarian Data:
0.683673469388
The Nearest Neighbors classifier was able to classify 62-70% of the training data correctly, and only 61% of the VA data.
The Decision Tree classifier was able to classify 73-80% of the training data correctly, and only 65% of the VA data.
My model in Excel classified 85% of the training data correctly and 77% of the VA data (with a change in the “points” system knowing that the VA file had fewer available columns). In this case, a “human touch” appeared to make a difference!
——————————————-
Overall, I learned a lot from this exercise and will definitely revisit it to improve the results and add more analysis (such as true/false positive and negative counts on the scikit-learn results, filling in the null values or removing those rows, and comparing results if the male and female patients are split into separate datasets to train separate models). I enjoyed learning Pandas and look forward to exploring more of what it can do! If you have suggestions for future analysis of this dataset, please put them in the comments. (Also please let me know if I made any glaring mistakes!) I’ll upload my files (linked below) so you can see all of my “playing around” with the data!
(messy) Excel file with my data exploration and point system for classifying
Heart Disease Classification python code(change file extension to .py after downloading — wordpress won’t let me upload as .py for security reasons)
Very interesting! Did you feel pandas was better with import and manipulation? Compared with, say, using the dplyr package for R? Or if you don’t use that, what are you comparing with? If you’ve got more exploratory posts like this in the pipeline I hope you post them soon, because I enjoyed reading this :)
Hi, thanks Natalie! I haven’t used dplyr (my R experience is very limited), and I was comparing to the “manual” (without a package to help) data importing I had done in past projects when I first learned Python, where I had to manipulate the columns using indexes to get what I wanted into the final set, and where the importing was less straightforward. You can see some of that here: https://www.becomingadatascientist.com/2014/04/10/ml-project-2-post-2/
I enjoyed being able to work with the columns by referencing their names. I know I just touched on the surface of what Pandas can do, and yes I am planning to do more practice projects like this soon!
Congratulations, I’m starting to learn data science as well, like, I’ve just started computer science but I have a feeling it is the right field for me, I’ll start posting my adventures really soon, you have gave me the courage, please, keep up the good work, is there somewhere else I can follow you?. Have a great day.
Oh, I’m from Recife, Brazil o/!
Hi Felipe,
Great, I’m glad to have given you courage to post about your data science adventures! Post a link here when you get that started! You can also follow me on twitter at @becomingdatasci.
Renee
Hello,
I couldn’t download the dataset. I couldnt find the one with 76 attributes. Could you please pass over that particular dataset?
Manasi
Hm, I used the one that is here called processed.Cleveland.data, I think
https://archive.ics.uci.edu/ml/machine-learning-databases/heart-disease/
Hello,
I couldn’t download the datase. can you mail me? [admin removed email]
It’s not my dataset. If you’re having trouble accessing it via the UCI respository, you should probably let them know. Sorry, but I don’t have time to re-download and email datasets to individuals when they’re available online.
heart_test_results[‘correct’] = heart_test_results[‘predict’] == goal_test_df[‘actual’]
File “/home/admin-pc/anaconda3/lib/python3.5/site-packages/pandas/core/ops.py”, line 735, in wrapper
raise ValueError(‘Series lengths must match to compare’)
I am unable to figure this error :/
hello very nice project for beginners. can you guide me how to proceed further? how to improve the accuracy??
I found if you prune some less useful features you can get up to 78%. I haven’t tried testing various initialization values for a classifier yet, but viewing it as regression got me to a stdev of 0.22 after testing many parameter initialization values. I’m not sure how to test the “accuracy” here without some threshold value, but I’d say it’s 90% accurate by eyeballing it (if you round to nearest integer values).